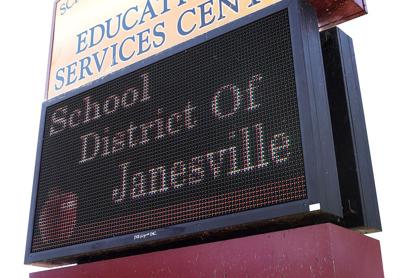
JANESVILLE — The School District of Janesville has significantly improved its state school report card compared to last year.
The school district earned a “Meets Expectations” rating on its 2024-25 report card from the Wisconsin Department of Public Instruction, which was released Tuesday.
The district’s overall accountability score rose by 5.9 points, moving it from the “Meets Few Expectations” category to the next performance tier. The score increased from 55.7 to 61.6, reflecting focused instructional strategies, staff commitment, and high student engagement across Janesville schools, school officials said.
Superintendent Mark Holzman called the nearly six-point improvement a “powerful movement,” adding that it “validates the efforts of our students who are showing up and putting in the work, and our educators who are committed to inspiring and empowering every learner.”
Dr. Allison DeGraaf, the school district’s director of learning and innovation, credited the results to focused work on key school improvement goals. The district saw growth in all four priority areas, with the most significant gains in supporting vulnerable students.
Target Group Outcomes: This area, which measures the performance of student at risk, saw the largest increase, rising 9.2 points to 51.3. Holzman noted this jump “confirms the effectiveness of our work to close opportunity gaps and support students who are most vulnerable.”
Achievement: The score increased by seven points to 61.5, driven by improved proficiency in English language arts and mathematics.
Growth: The score climbed 4.8 points to 55.6.
On-Track to Graduation: This indicator increased by three points, reaching 80.8.
DeGraaf attributed the success to two key factors: the implementation of new K-12 curricula in reading and math over the last several years, and consistent use of professional learning teams where teachers analyze student data weekly.
“The increased results demonstrate the dedicated effort of our students and the commitment of our teachers to use data to drive instructional strategies and decisions in the classroom,” she said.
Holzman emphasized the critical role of an operational referendum approved last fall, in sustaining the staff and programs that led to the rising rating.
“We asked the public to continue a $14.5 million referendum. Eighty percent of our budget is people,” Holtzman explained. “Staff is what makes a difference in how our students learn. We know that the number one influencer for elevated student achievement is a teacher.”
Holzman said that without the referendum resources, the district would have to reduce staff, leading to higher class sizes, especially in K-2, where the goal is under 22 students, and less curricular support. Holzman described the referendum as the “baseline” and the “lifeblood” of district operations, noting that School District of Janesville also uses those funds to pay for services the state mandates but underfunds.
“The state says we have to have the resources, but they only fund 40% (of special education costs). So still, we’re using some of those referendum dollars to pay for things that the state just doesn’t pay for on a regular basis.”
Holzman added that the referendum also supports comprehensive high school offerings not fully captured on the report card, such as the arts, athletics, and workforce development programs like the business hub and youth apprenticeships.
Both leaders stressed that the report card is not a comparison tool between districts, a point they feel is often misunderstood.
Holzman explained that the weighting of the four priority areas — achievement, growth, target group outcomes, and on-track to graduation — is unique to each district based on its population of students qualifying for free or reduced lunch, a measure of economic disadvantage.
Equity balance: Districts with a higher percentage of economically disadvantaged students, like Janesville which has about 54% of students eligible for free and reduced lunch compared to a district like Whitefish Bay with 1%, have their report cards weighted more heavily toward student growth and less toward pure achievement.
Addressing opportunity gaps: This weighting is designed to balance equity, acknowledging that students with greater financial stability often have more resources (books, stable homes, regular healthcare) that contribute to preparedness and higher initial achievement scores.
The attendance factor: Holzman pointed out that for elementary schools, the on-track to graduation category is simply measured by attendance. “In districts that have low poverty, high affluency, their attendance is just better... so they get to count that twice,” he said, resulting in higher scores for those districts.
“The report card is not meant to be a comparison because every district’s story is a little bit different,” Holzman asserted. “That’s why you can’t compare the report card score to another district... everybody’s a little bit different.”
The administration concluded by celebrating the growth and committing to continued improvement.
“Achieving a 9.2 jump in target group outcomes confirms the effectiveness of our work to close opportunity gaps,” Holzman noted. The district will continue to analyze data, including local assessments, to refine instructional practices, he said.
Holzman also noted that he and DeGraff received an email from a state agency asking them to do a presentation because they saw some significant growth in the school district of Janesville.
“I believe that we’re going to start seeing other people outside of our region going, “Huh, what are you doing that’s making a difference in elevating student outcomes?” And that’s just a testament to the people who are doing the work,” he said, citing staff, students, families, and community partners as the people “doing the work”.
The full 2024-25 district and individual school report cards are available on the district website, , or and the DPI report card portal at .


